Control Systems

Mitsubishi Power has developed and supplied control systems that maintain high reliability and utilization rates while meeting maintenance support and safety requirements at power plants over several decades and throughout the lifecycle of machinery and equipment.
In addition, as we head toward the IoT era, control systems have become key devices in the handling of enormous volumes of process information as well as local device information. This has created the need for control systems to strike a balance between openness and high security in order to work with higher level systems and achieve optimum operation.
DIASYS Series
A combination of know-how and expertise based on over 35 years of experience in the field of control and monitoring systems
The Digital Intelligent Automation SYStem, or DIASYS, maintains high reliability and an impressive utilization rate as a system, while incorporating the extensive expertise and control technologies Mitsubishi Power possesses as a plant manufacturer, culminating in a distributed control system (DCS) with ease of handling for everyone, from operators to plant engineers and maintenance personnel.
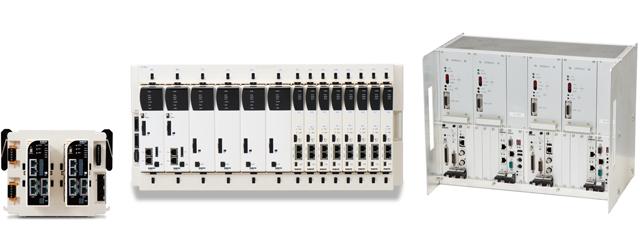
HIACS Series (Reference)
An integrated supervisory & control system for thermal power plants combining a vast track record with prowess in control technologies
G-HIACS, which represents the continued evolution of the HIACS series and its more than four decades of achievements, utilizes the features of high reliability, straightforward operability and excellent expandability to provide optimum solutions that meet the demands of power plant operation.
