Shaft Vibration Analyzer
Overview
This system analyzes the shaft vibration of various rotating machines such as generator turbines, and also calculates the balance of the shaft.
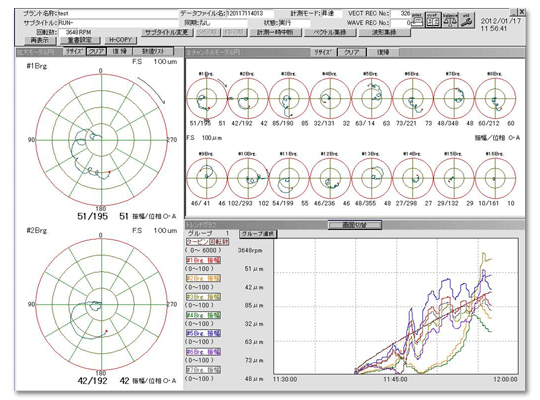
Based on a phase reference signal and the vibration waveform signal measured with a shaft vibration detection sensor, modal circles (Nyquist plots), V-S graphs (vibration vs. rotation speed graphs), and other graphs can be displayed in real time, allowing you to confirm that the rotating machine is working properly.
In addition, by using the modal circles mentioned above, you can also calculate the optimum mass and location of a balance weight to offset the unbalanced component (location of the balance hole).

Example of Online Screen Monitoring
Features
Data Analysis
Phase Analysis
Vibration vectors are calculated based on a phase reference signal and the vibration waveform signal.
A modal circle is a plot of vibration vectors when the machine's speed of rotation increases or decreases.
Frequency Analysis
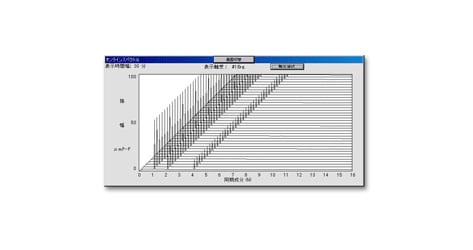
The vibration spectrum is calculated by performing FFT analysis of the vibration waveform signal.
Trajectory of The Center of The Shaft
The center position of the shaft can be calculated from the gap voltage of the vibration waveform signal.
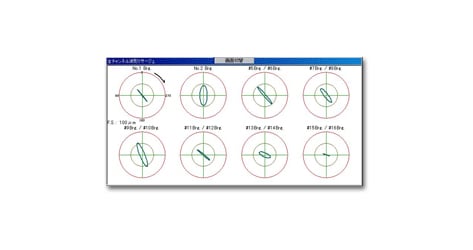
Lissajous Curve
The movement of the center position of the shaft when the shaft rotates once can be calculated.

Online Spectra

Lissajous Curve Linking All Channels
Balance Calculation
The vibration vectors and the effect vector (the vector that indicates the effect of installing a balance weight) are measured at a maximum of 16 evenly distributed rotation speeds. Vibration values at six of those measurement points are selected and, based on them, the optimum mass and installation location for a balance weight can be calculated to minimize vibration.
System Configuration

Shaft Vibration Analyzer
- A one-pulse signal and the shaft vibration signal measured by a sensor installed on the rotating machine are fed into the shaft signal analyzer.
- Based on the measured data, the system performs analyses including phase and frequency analyses.
- The analysis results are displayed on a monitor.
- The analysis results are saved to an HDD.
Products
- GTCC
- Steam Power
- IGCC
- Geothermal
-
Gas Turbines
- Product Lineup
- Comparative Performance
-
Technical Information
- Gas Turbines for Mechanical Drive Applications
- Cutting-Edge Elemental Technology Producing 1600°C Class J Gas Turbines
- Development of High-Efficiency Gas Turbine Applying 1600°C Class J Technology
- Combustor Technologies Supporting Stable Operation
- Overview and Verification Status of T-Point 2 Demonstration Facility
- Comprehensive Efforts from Development to Manufacturing
- Summary of Orders
- Development History
- Product Selection Assistant (Middle & small Class)
- Aero-derivative Gas Turbines
- Steam Turbines
- Boilers
- Air Quality Control Systems (AQCS)
- Generators
-
Control Systems
- What is DIASYS?
- DIASYS Netmation
-
DIASYS Optional Products
- IR-S Infrared Flame Detector
- Net IR-S Infrared Flame Detector
- Rail Mounting Net IR-S
- Boiler Tube Leak Detector
- Shaft Vibration Analyzer
- Simulator
- Advanced Combustion Pressure Fluctuation Monitoring System (A-CPFM) / Combustion Pressure Fluctuation Monitoring System (CPFM)
- Multi-Coal Fired Boiler Optimum Control
- FXtoLS Adapter
- Fuel Cells
- Additive Manufacturing
- Catalogue
- HIACS Series
- Technical Report